What is a Business Intelligence Platform? Understanding the Core
At its heart, a business intelligence (BI) platform is a comprehensive software solution designed to collect, process, analyze, and visualize vast amounts of data from various sources, transforming it into meaningful and actionable insights. It serves as a centralized hub for an organization’s data, empowering decision-makers at all levels with a clearer, more holistic view of business performance. Unlike traditional reporting tools that often provide static views of past data, a BI platform is dynamic, interactive, and forward-looking, enabling users to explore data, identify trends, predict outcomes, and optimize strategies in real-time.
Think of it as the ultimate data translator. Businesses generate data constantly: sales figures, customer interactions, marketing campaign performance, supply chain logistics, financial records, and much more. Without a BI platform, this data often remains siloed, incomprehensible, or simply too voluminous to process manually. A BI platform ingests this raw information, cleanses it, organizes it, and then presents it in intuitive dashboards, reports, and visualizations that highlight key performance indicators (KPIs), expose bottlenecks, and reveal hidden opportunities.
The core objective of a BI platform is to facilitate informed decision-making. Instead of relying on gut feelings, anecdotal evidence, or outdated information, businesses can make strategic choices backed by robust data analysis. This translates into numerous benefits, from optimizing marketing spend and personalizing customer experiences to streamlining operational processes and identifying new market segments. For instance, a digital marketing team can use a BI platform to correlate ad spend across various channels with conversion rates and customer lifetime value, instantly seeing which campaigns deliver the highest ROI and where adjustments need to be made. A content strategy professional might analyze content performance across different platforms, identifying topics and formats that resonate most with their target audience, leading to more effective content creation and distribution.
In essence, a BI platform moves an organization beyond simply having data to truly understanding its business. It democratizes access to critical information, allowing various departments—from sales and marketing to finance, operations, and HR—to leverage data relevant to their specific goals. This shared understanding fosters greater collaboration, aligns departmental objectives with overarching business goals, and ultimately drives more cohesive and effective strategies for sustained business growth in 2026 and beyond.
Key Components and Features of a BI Platform
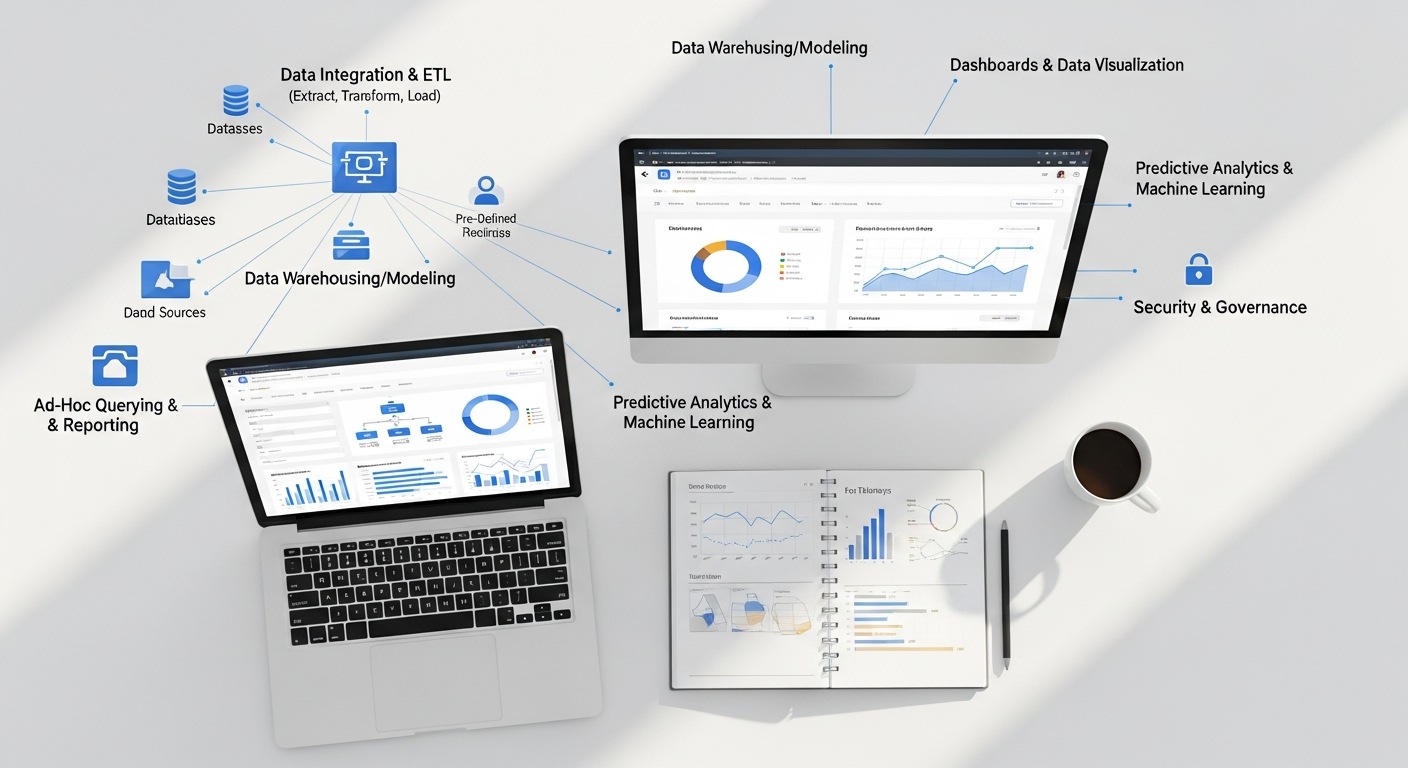
A robust business intelligence platform is not a monolithic tool but rather an integrated suite of capabilities working in harmony to deliver comprehensive data insights. Understanding these key components is crucial for appreciating the power and versatility a BI platform brings to an organization.
- Data Integration and ETL (Extract, Transform, Load): This is the foundational layer. BI platforms must be able to connect to a multitude of disparate data sources—databases, spreadsheets, cloud applications (CRM, ERP, marketing automation platforms), social media APIs, IoT devices, and more. The ETL process involves extracting data from these sources, transforming it into a consistent and usable format (cleaning, standardizing, enriching), and then loading it into a central repository, often a data warehouse or data lake. This ensures data quality and consistency, which is paramount for accurate analysis.
- Data Warehousing/Data Lake Capabilities: Once integrated, data needs a place to reside. A data warehouse is a structured repository optimized for querying and reporting, typically storing historical data for analytical purposes. A data lake, on the other hand, can store vast amounts of raw, unstructured, and semi-structured data, offering greater flexibility for advanced analytics and machine learning. Many modern BI platforms can leverage both, providing a comprehensive storage solution for diverse data types.
- Data Modeling and Governance: Data modeling involves organizing the integrated data in a way that makes it easy to analyze and understand relationships between different datasets. This often includes creating schemas, hierarchies, and relationships. Data governance, meanwhile, establishes policies and procedures for data quality, security, privacy, and accessibility, ensuring that data is reliable, compliant, and properly managed. This is crucial for maintaining trust in the insights generated.
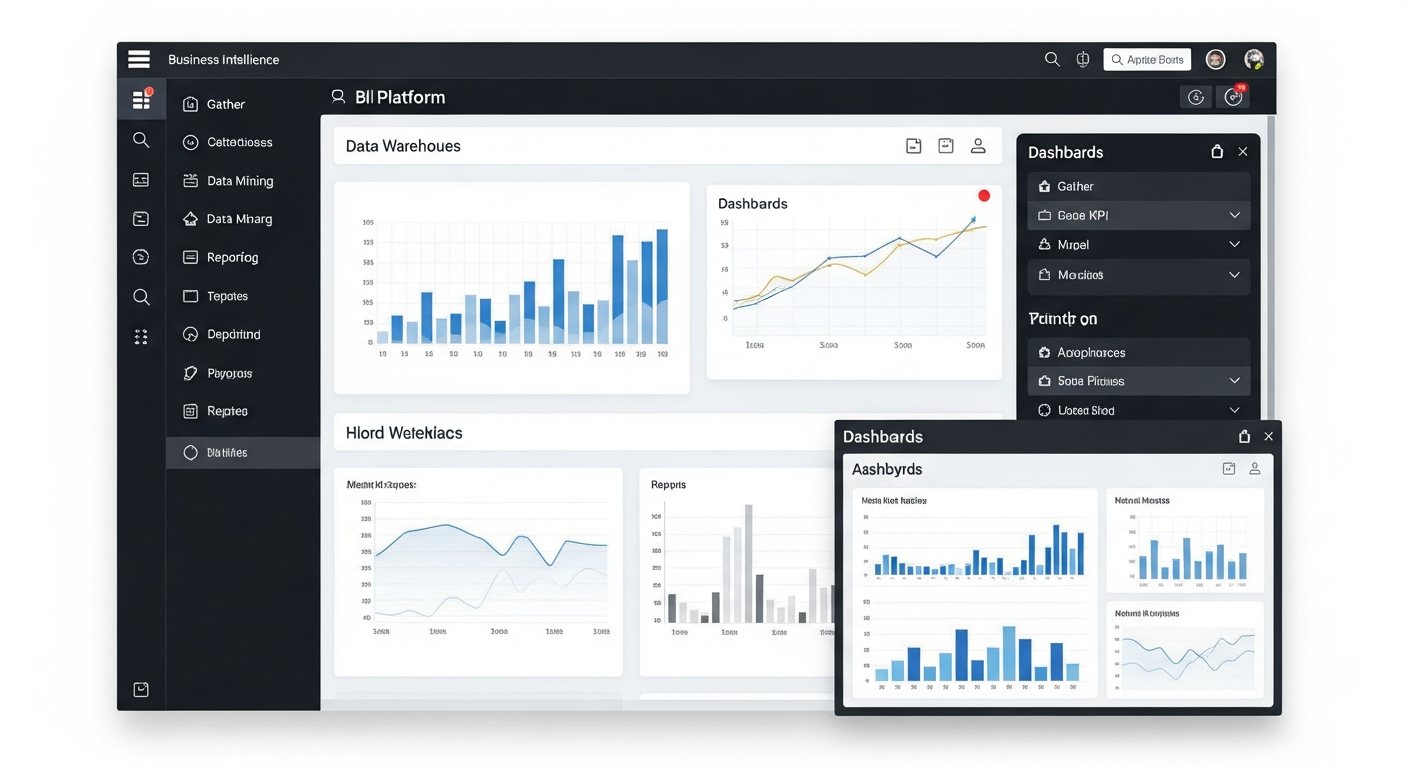
- Reporting and Dashboarding: These are the most visible aspects of a BI platform. Dashboards provide a high-level, interactive overview of key metrics and KPIs, often in real-time. Reports offer more detailed, structured views of data, suitable for specific analyses or regulatory compliance. Both are highly customizable, allowing users to tailor views to their specific needs and roles. A marketing director, for example, might have a dashboard tracking campaign performance, website traffic, and lead generation, while a sales manager focuses on regional sales figures and conversion rates.
- Ad-hoc Querying and Analysis: Beyond pre-defined reports, BI platforms enable users to perform their own “slice and dice” analysis. This means non-technical users can ask specific questions of the data, drill down into details, pivot tables, and explore different dimensions without needing to write complex code or rely on IT. This self-service capability empowers business users to gain immediate answers to their evolving questions.
- Data Visualization: Presenting complex data in an understandable format is critical. BI platforms offer a rich array of visualization tools, including charts (bar, line, pie), graphs, scatter plots, heat maps, geographical maps, and custom infographics. Effective data visualization makes trends, patterns, and outliers immediately apparent, facilitating quicker comprehension and insight generation.
- Predictive Analytics and Machine Learning (ML): Advanced BI platforms go beyond describing what happened (descriptive analytics) and explaining why it happened (diagnostic analytics) to predicting what will happen (predictive analytics) and even recommending actions (prescriptive analytics). By incorporating machine learning algorithms, these platforms can forecast future trends, identify potential risks, segment customers for personalized campaigns, and optimize various business processes, offering a significant competitive edge.
- Collaboration and Sharing: Insights are most powerful when shared. BI platforms facilitate collaboration by allowing users to share reports, dashboards, and analyses with colleagues, annotate findings, and discuss implications within the platform itself. This fosters a data-driven culture and ensures that insights are disseminated efficiently across the organization.
- Security and Access Control: Given the sensitive nature of business data, robust security features are non-negotiable. BI platforms offer granular access controls, allowing administrators to define who can view, edit, or share specific data sets or reports. This ensures compliance with data privacy regulations and protects proprietary information. This ties directly into the broader concept of Services every secure business needs, emphasizing the importance of data protection not just within the BI platform but across the entire enterprise infrastructure. From identity and access management to data encryption and regular security audits, a comprehensive security strategy is vital.
- User Interface/Experience (UI/UX): An intuitive and user-friendly interface is critical for user adoption. A well-designed BI platform makes it easy for business users, regardless of their technical proficiency, to navigate, explore data, and create their own reports and dashboards, maximizing the return on investment.
The combination of these components allows a BI platform to transform raw data into a strategic asset, providing the foundation for intelligence-driven business growth and continuous improvement.
How a BI Platform Works: The Data Journey
1. Data Collection and Connection
The first step is gathering data from all relevant sources. A BI platform offers connectors to a vast array of systems, both internal and external. This includes enterprise resource planning (ERP) systems, customer relationship management (CRM) platforms, marketing automation tools, financial systems, human resources databases, website analytics (e.g., Google Analytics), social media platforms, IoT devices, point-of-sale (POS) systems, and even flat files like spreadsheets or CSVs. The platform establishes secure connections to these sources, allowing it to pull in the necessary data.
2. Data Integration and Transformation (ETL)
Once collected, the data is rarely in a perfect state for analysis. It might be inconsistent, incomplete, or formatted differently across various sources. This is where the Extract, Transform, Load (ETL) process comes into play:
- Extract: Data is pulled from the source systems.
- Transform: This is a critical stage where data is cleaned, standardized, de-duplicated, enriched, and aggregated. For example, dates might be standardized to a single format, customer names corrected for spelling errors, or sales data aggregated by month or quarter. Business rules are applied to ensure data quality and consistency.
- Load: The transformed data is then loaded into a central data repository, typically a data warehouse or data lake, which is optimized for analytical queries rather than transactional processing.
This ETL process ensures that the data is reliable, accurate, and ready for analysis, forming a single source of truth for the organization.
3. Data Storage and Modeling
The data warehouse or data lake acts as the central repository, designed for efficient querying and reporting. Within this repository, data is often modeled in a way that makes it easier to understand and analyze. This involves organizing data into logical structures (e.g., star schemas or snowflake schemas) that define relationships between different tables (e.g., linking customer data to sales data to product data). Data modeling helps optimize query performance and simplifies the process for end-users to find and analyze relevant information without deep technical knowledge.
4. Data Analysis and Processing
With the data properly stored and modeled, the BI platform’s analytical engine gets to work. This involves:
- OLAP (Online Analytical Processing): This allows for multi-dimensional analysis, enabling users to “slice and dice” data along various dimensions (e.g., sales by product, by region, by quarter, by customer segment).
- Ad-hoc Querying: Users can formulate specific questions and queries against the data without predefined reports.
- Statistical Analysis: The platform can perform statistical calculations to identify correlations, regressions, and other patterns.
- Predictive Analytics: Leveraging machine learning algorithms, the platform can analyze historical data to forecast future trends, predict customer behavior, or identify potential risks.
This stage is about extracting meaningful patterns and insights from the vast datasets.
5. Data Visualization and Reporting
The insights generated from analysis are then presented in an easily digestible and interactive format. This is where the dashboards and reports come into play:
- Dashboards: Provide dynamic, real-time overviews of key performance indicators (KPIs) using various visualizations like charts, graphs, gauges, and maps. Users can often interact with dashboards, drilling down into specific data points for more detail.
- Reports: Offer more structured and detailed views of data, often generated on a scheduled basis or on demand for specific purposes (e.g., monthly sales reports, quarterly financial summaries).
- Interactive Visualizations: Users can manipulate charts, filter data, and change parameters to explore different facets of the information, turning static data into an engaging narrative.
6. Insight Generation and Action
The ultimate goal of this entire process is to generate actionable insights that empower decision-makers. By presenting complex data in a clear, intuitive manner, the BI platform helps users:
- Identify critical trends and patterns (e.g., a surge in customer churn in a specific demographic).
- Uncover root causes of performance issues (e.g., a drop in conversion rates linked to a specific landing page).
- Spot new opportunities (e.g., an underserved market segment for a new product).
- Monitor performance against strategic goals.
- Make data-driven decisions that lead to improved outcomes.
The iterative nature of this process means that insights gained can inform new data collection strategies or lead to further, deeper analysis, creating a continuous loop of learning and improvement for the business.
Benefits of Implementing a Business Intelligence Platform

Implementing a business intelligence platform is a strategic investment that yields a multitude of benefits, transforming how organizations operate and grow. For marketers, content strategists, and business growth professionals, these advantages are particularly impactful, enabling more effective strategies and a stronger competitive stance.
1. Improved Decision Making
This is arguably the most significant benefit. BI platforms replace gut feelings and anecdotal evidence with concrete, data-backed insights. Decision-makers can quickly access accurate, up-to-date information, allowing them to make more informed and strategic choices across all business functions. Whether it’s choosing the right marketing channel, optimizing inventory levels, or developing new products, decisions are grounded in facts.
2. Enhanced Operational Efficiency
By providing clear visibility into operational processes, BI platforms help identify inefficiencies, bottlenecks, and areas for improvement. For example, a manufacturing business can use a BI platform to monitor production line performance, raw material consumption, and waste generation in real-time. This allows them to quickly pinpoint issues, reduce downtime, and optimize resource allocation. This directly relates to the importance of specialized services, such as the 3 services you need for your manufacturing business, which often include operational analytics, supply chain optimization, and predictive maintenance – all of which are significantly enhanced by a robust BI platform.
3. Identification of Trends and Opportunities
BI tools excel at spotting patterns and trends that would be invisible in raw data. This could be anything from emerging market opportunities and shifts in customer preferences to seasonal demand variations or potential risks. Marketers can identify rising content topics, optimal posting times, or underperforming campaigns, allowing for proactive adjustments and innovation.
4. Better Customer Understanding and Personalization
By integrating data from CRM, sales, marketing, and customer service, a BI platform creates a 360-degree view of the customer. This enables businesses to understand customer behavior, preferences, demographics, and purchasing patterns in detail. With this insight, organizations can personalize marketing messages, tailor product offerings, improve customer service, and build stronger, more loyal relationships, ultimately driving higher customer lifetime value.
5. Competitive Advantage
In a rapidly evolving market, the ability to quickly adapt and innovate is crucial. A BI platform provides the agility needed to respond to market changes faster than competitors. By continuously monitoring market trends, competitor activities, and internal performance, businesses can identify opportunities for differentiation and capitalize on them before others do. This proactive approach ensures sustainable growth and market leadership.
6. Cost Savings and Revenue Growth
By optimizing processes, reducing waste, identifying profitable customer segments, and improving marketing ROI, BI platforms directly contribute to cost savings and increased revenue. For instance, by identifying which marketing channels are most effective, businesses can reallocate budgets to maximize returns, leading to significant revenue growth without necessarily increasing overall spend.
7. Risk Management
BI platforms can help identify potential risks before they escalate. This includes financial risks, operational risks, compliance risks, and security vulnerabilities. Real-time monitoring and predictive analytics allow organizations to anticipate problems and implement mitigating strategies, protecting assets and reputation. This is another area where a comprehensive approach to Services every secure business needs becomes critical, as a BI platform provides the analytical layer to monitor and report on security metrics, but requires underlying infrastructure and policies to ensure data integrity and protection.
8. Enhanced Collaboration and Data Culture
By providing a single source of truth and easy access to data, BI platforms break down data silos between departments. This fosters greater collaboration, as teams can work with the same accurate information, align their goals, and make decisions collectively. It also cultivates a data-driven culture, where employees at all levels are empowered to use data to inform their work and contribute to organizational success. Companies like phdata specialize in building and managing these data platforms, and understanding 3 ways phdata can benefit your business highlights their expertise in areas like data engineering, cloud data platforms, and machine learning, all of which amplify the benefits derived from a BI platform.
In summary, a business intelligence platform is more than just a reporting tool; it’s a strategic asset that drives efficiency, fosters innovation, enhances customer relationships, and provides the agility needed to thrive in the complex business environment of 2026 and beyond.
Choosing the Right BI Platform for Your Business
Selecting the ideal business intelligence platform is a critical decision that can significantly impact your organization’s ability to leverage data for growth. With numerous options available, it’s essential to approach this choice strategically, considering your specific needs, budget, and long-term goals. Here’s a comprehensive guide to help you navigate the selection process:
1. Assess Your Business Needs and Objectives
Before even looking at specific platforms, clearly define what you want to achieve with BI. Ask yourself:
- What business problems are you trying to solve? (e.g., improve marketing ROI, optimize supply chain, enhance customer retention).
- Which departments will use the BI platform, and for what purposes? (e.g., sales for pipeline analysis, marketing for campaign performance, finance for budget tracking).
- What key performance indicators (KPIs) do you need to track and visualize?
- What types of reports and dashboards are essential for your decision-makers?
- Do you need advanced capabilities like predictive analytics or machine learning?
Understanding your objectives will narrow down the field considerably.
2. Evaluate Data Sources and Integration Capabilities
Your BI platform must seamlessly connect to all your relevant data sources. List every system that holds critical business data: CRM, ERP, marketing automation, accounting software, databases, cloud applications, web analytics platforms, and so on. Look for platforms with:
- Pre-built connectors for your existing systems.
- Robust ETL capabilities to clean, transform, and load data efficiently.
- The ability to handle diverse data types (structured, semi-structured, unstructured).
- Support for real-time data ingestion if immediate insights are crucial.
3. Consider Scalability and Performance
Your data volume will likely grow over time, as will the number of users accessing the platform. Choose a BI solution that can scale with your business without compromising performance. Evaluate:
- How the platform handles increasing data volumes.
- Its ability to support a growing number of concurrent users.
- Query performance and response times, especially with large datasets.
- Cloud-native solutions often offer superior scalability and flexibility compared to on-premise deployments.
4. Ease of Use and User Adoption
Even the most powerful BI platform is useless if users can’t or won’t use it. Prioritize platforms with an intuitive user interface (UI) and a strong focus on user experience (UX):
- Self-service BI: Can business users easily create their own reports and dashboards without extensive IT involvement?
- Data Visualization: Does it offer a wide range of clear, interactive visualization options?
- Learning Curve: Is it relatively easy for new users to learn and master?
- Mobile Access: Does it provide robust mobile capabilities for on-the-go access to insights?
High user adoption is critical for maximizing your ROI.
5. Security and Data Governance
Data security is paramount. Your BI platform will house sensitive business information, making robust security features non-negotiable. Look for:
- Granular access controls and role-based security.
- Data encryption at rest and in transit.
- Compliance with relevant data privacy regulations (e.g., GDPR, CCPA).
- Audit trails and logging capabilities.
- Strong data governance features to ensure data quality, integrity, and compliance.
This point underscores the broader need for Services every secure business needs, extending beyond the BI platform itself to encompass network security, endpoint protection, incident response, and continuous monitoring. A BI platform integrates into this larger security ecosystem.
6. Cost and Total Cost of Ownership (TCO)
Beyond the initial licensing fees, consider the total cost of ownership, which includes:
- Software licenses (subscription or perpetual).
- Implementation costs (consulting, integration, data migration).
- Training costs for users.
- Maintenance and support fees.
- Hardware costs (for on-premise solutions).
- Potential costs for additional modules or connectors.
Compare pricing models (per user, per server, based on data volume) and consider the long-term budget implications.
7. Vendor Reputation and Support
Research the vendor’s track record, customer reviews, and industry standing. Evaluate their commitment to ongoing development, product roadmap, and customer support. A reliable vendor provides:
- Comprehensive documentation and training resources.
- Responsive technical support.
- A strong user community.
- Regular updates and new features.
For complex implementations or if you lack internal data expertise, consider partnering with specialists. Companies like phdata, for example, can provide invaluable assistance in designing, implementing, and optimizing your data platform. Exploring 3 ways phdata can benefit your business might reveal their capabilities in cloud data strategy, data engineering, and machine learning operations – services that complement and enhance your BI platform investment.
8. Specific Industry Considerations
Some industries have unique data requirements. For example, a manufacturing business might need specific capabilities for IoT data integration, operational technology (OT) data analysis, or predictive maintenance. The 3 services you need for your manufacturing business, such as shop floor analytics, supply chain optimization, and quality control, can be directly powered and monitored through a specialized BI platform capable of handling these distinct datasets.
By meticulously evaluating these factors, you can make an informed decision that aligns your BI platform choice with your strategic business goals, ensuring a successful implementation and a tangible return on your investment in 2026 and beyond.
The Future of Business Intelligence Platforms in 2026 and Beyond
The landscape of business intelligence is in a constant state of evolution, driven by advancements in artificial intelligence, machine learning, and the ever-increasing volume and velocity of data. As we look towards 2026 and beyond, BI platforms are set to become even more intelligent, intuitive, and integrated, blurring the lines between traditional analytics and advanced decision support systems.
1. Pervasive AI and Machine Learning Integration
AI and ML are already transforming BI, but their integration will become even more seamless and pervasive. Instead of separate modules, AI capabilities will be embedded into every layer of the BI platform, from data ingestion and preparation to analysis and insight generation. This will manifest in:
- Augmented Analytics: Automated insights generation, where the platform proactively identifies patterns, anomalies, and correlations without explicit user prompting. It will explain why certain trends are occurring and suggest next best actions.
- Automated Data Preparation: AI-driven tools will automate much of the laborious data cleaning, transformation, and modeling, significantly reducing the time and effort required for data preparation.
- Predictive and Prescriptive Capabilities: Standard BI dashboards will not only show what happened but also predict what will happen and even recommend specific actions to optimize outcomes.
2. Natural Language Processing (NLP) and Conversational BI
The ability to query data using natural language, much like asking a question to a virtual assistant, will become a standard feature. Users will be able to type or speak questions like “Show me sales performance for Q3 2026 by region” or “What are the top 5 product categories driving growth this month?”, and the BI platform will generate the relevant reports and visualizations instantly. This will further democratize data access, making BI accessible to an even wider audience, including less data-savvy business users.
3. Real-time and Streaming Analytics
While many BI platforms already offer near real-time capabilities, the future will see a greater emphasis on true streaming analytics. Businesses will be able to monitor and analyze data as it’s generated, enabling immediate responses to critical events. For example, a marketing team could monitor campaign performance second-by-second and adjust bids or messaging instantly based on live engagement metrics. This is particularly crucial for industries like finance, e-commerce, and IoT-driven operations.
4. Embedded BI and Data Storytelling
BI capabilities will increasingly be embedded directly into operational applications, CRM systems, ERPs, and even custom business tools. This means users won’t have to switch between applications to gain insights; the data will be available within their workflow, at the point of decision. Alongside this, there will be a greater focus on “data storytelling” – the ability of BI platforms to not just present data, but to weave it into a compelling narrative that explains the context, highlights key insights, and suggests clear actions. This will involve more dynamic, interactive, and guided analytical experiences.
5. Edge BI and IoT Integration
With the proliferation of IoT devices, more data is being generated at the “edge” – away from central data centers. Future BI platforms will enhance their ability to process and analyze data directly at the edge, reducing latency and bandwidth requirements. This “Edge BI” will be critical for applications in manufacturing (e.g., real-time machine health monitoring), logistics, and smart cities, enabling immediate operational responses without sending all data to the cloud.
6. Enhanced Data Governance and Ethical AI
As data becomes more central to decision-making and AI’s role expands, robust data governance and ethical AI practices will be paramount. BI platforms will incorporate more advanced features for ensuring data quality, privacy, security, and compliance. There will be a stronger emphasis on explainable AI (XAI), ensuring that the insights and recommendations provided by AI-driven BI are transparent and understandable, mitigating biases and building trust.
7. Hyper-Personalization and Customer 360
BI platforms will continue to evolve their ability to create hyper-personalized customer experiences. By integrating an even broader range of customer data (behavioral, transactional, demographic, sentiment), they will enable businesses to anticipate individual customer needs, offer tailored recommendations, and predict churn with greater accuracy, driving unprecedented levels of customer engagement and loyalty.
In conclusion, the future of business intelligence platforms in 2026 and beyond points towards an era of highly intelligent, autonomous, and seamlessly integrated systems. These platforms will not just inform decisions but actively guide them, transforming organizations into truly data-driven entities capable of unprecedented agility, innovation, and growth. For any business professional aiming to stay ahead, embracing these evolving capabilities will be non-negotiable.
Frequently Asked Questions
Recommended Resources
For more on what is a, see Best Store Credit Cards For Rewards 2026 on Gold Points.
Check out How To Automate Your Business Processes on Kacerr for a deeper dive.