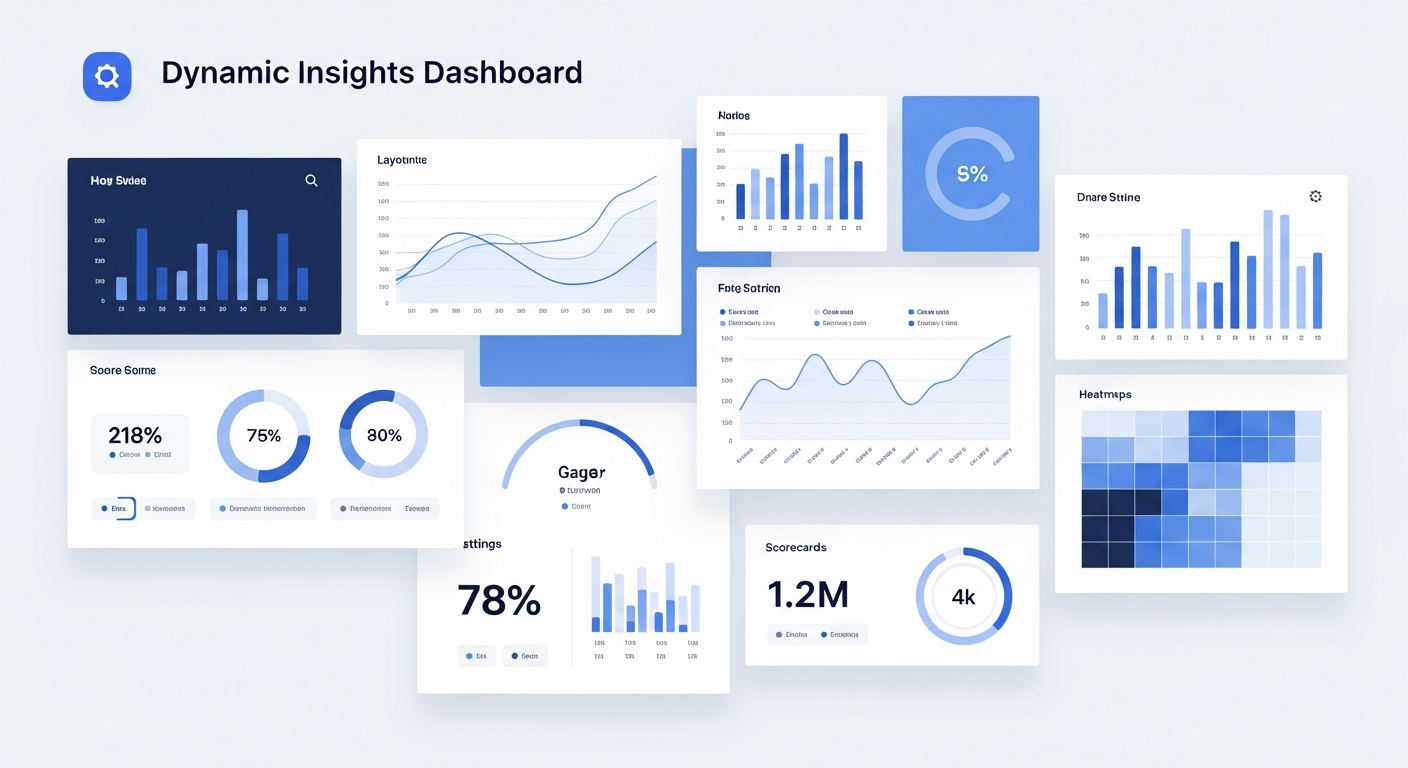
The Ultimate Guide to Custom Dashboard Software for KPIs in 2026
In the hyper-competitive business landscape of 2026, data is no longer just an asset; it is the primary engine of growth. However, as organizations find themselves drowning in a sea of metrics, the challenge has shifted from collecting data to interpreting it. This is where custom dashboard software for KPIs (Key Performance Indicators) becomes indispensable. Unlike generic, one-size-fits-all reporting tools, custom dashboards allow business owners and professionals to filter out the noise and focus on the specific metrics that drive their unique goals. Whether you are tracking real-time sales performance, monitoring supply chain efficiency, or measuring customer lifetime value, a tailored visual interface transforms raw numbers into actionable intelligence. This guide explores why custom solutions are the new standard for data-driven leadership and how to choose the right platform to scale your operations in the coming years.
The Evolution of KPI Tracking: Why Off-the-Shelf Isn’t Enough
For years, many businesses relied on the built-in reporting features of their CRM or ERP systems. While these tools provided basic insights, they often existed in silos. A marketing team might see lead generation data in one app, while the finance team viewed revenue in another, creating a fragmented view of the company’s health.
By 2026, the complexity of the modern tech stack—often comprising dozens of SaaS applications—has made these “walled garden” reports obsolete. Custom dashboard software solves this by acting as a centralized hub. It pulls data from various sources via APIs, normalizing and presenting it in a unified view.
The primary limitation of off-the-shelf software is its rigidity. Every business has a unique “North Star” metric. For a subscription-based software company, it might be the LTV/CAC ratio (Lifetime Value to Customer Acquisition Cost). For a manufacturing firm, it might be OEE (Overall Equipment Effectiveness). Generic tools often lack the flexibility to calculate these complex, multi-source formulas. Custom solutions allow you to build proprietary calculations into the interface, ensuring that your dashboard reflects your specific business logic, not a developer’s template.
Key Features of Modern Custom Dashboard Software
When evaluating custom dashboard software today, the baseline for “good” has shifted. It is no longer enough to have pretty charts; the software must be intelligent, responsive, and deeply integrated. Here are the non-negotiable features for 2026:
#
1. Real-Time Data Synchronization
Delayed data is dangerous. In a world where market shifts happen in minutes, your dashboard must offer real-time or near-real-time updates. This ensures that when a KPI turns red, your team can respond immediately rather than discovering the issue during a monthly review.
#
2. Low-Code/No-Code Interface
Customization shouldn’t require a degree in data science. The best custom dashboard tools offer “drag-and-drop” functionality. This empowers department heads—rather than just the IT department—to build and modify their own views.
#
3. AI-Driven Predictive Analytics
Modern custom dashboards do more than show what happened; they predict what *will* happen. Through machine learning algorithms, these tools can identify trends and provide “what-if” scenarios. For example, “If current lead conversion rates hold, you will hit 95% of your quarterly target.”
#
4. Role-Based Access and Personalization
A CEO needs a different view than a floor manager. Custom software allows for granular permission levels, ensuring that stakeholders see exactly what is relevant to them. This prevents “dashboard fatigue” and keeps sensitive financial data secure.
Industry-Specific Use Cases: From Retail to SaaS
The power of a custom KPI dashboard is best seen through the lens of specific industries. By tailoring the visualization to the nuances of a sector, businesses can uncover insights that were previously hidden.
#
E-commerce and Retail
In 2026, retail is omnichannel. A custom dashboard can merge data from Amazon, Shopify, physical Point-of-Sale (POS) systems, and social media advertising. Instead of looking at “sales,” a custom dashboard can track “Net Profit per Order” after accounting for shipping costs, returns, and ad spend in real-time.
#
Healthcare Management
Healthcare providers use custom dashboards to track patient outcomes, wait times, and staff allocation. By integrating Electronic Health Records (EHR) with operational data, administrators can visualize the correlation between staffing levels and patient satisfaction scores, allowing for more efficient resource management.
#
B2B SaaS (Software as a Service)
For SaaS companies, churn is the enemy. A custom dashboard can create a “Customer Health Score” by combining login frequency, support ticket volume, and feature adoption rates. When a high-value client’s health score drops, the dashboard can automatically alert the Customer Success team to intervene.
How to Choose the Right Custom Dashboard Provider
Selecting a provider is a long-term strategic decision. The market in 2026 is saturated, but you can narrow your choices by focusing on three critical pillars: scalability, security, and support.
**Scalability** is the most overlooked factor. Many tools work perfectly when you have 10,000 rows of data but crawl to a halt when you reach 10 million. Ensure the software uses high-performance data warehousing or can connect directly to robust databases like Snowflake or BigQuery without lag.
**Security and Compliance** are paramount. With data privacy laws becoming more stringent globally, your dashboard provider must offer SOC 2 Type II compliance, end-to-end encryption, and multi-factor authentication. If you are in a regulated industry like finance or healthcare, the ability to host the software on-premise or in a private cloud may be a requirement.
Finally, consider the **Implementation Support**. A tool is only as good as its setup. Does the provider offer dedicated account managers or “onboarding engineers” to help you map your data sources? Avoid “ghost” companies that offer no human support, as the initial mapping of custom KPIs can often be technically challenging.
The ROI of Data Visualization: Turning Metrics into Money
Investing in custom dashboard software for KPIs is not an IT expense; it is a profit-driving strategy. The Return on Investment (ROI) manifests in three main areas:
1. **Speed of Decision Making:** In a manual reporting environment, it might take a week to compile a cross-departmental report. By then, the opportunity has passed. Custom dashboards reduce “time-to-insight” to seconds.
2. **Alignment and Accountability:** When KPIs are displayed on screens in the office or shared in Slack channels, everyone knows the score. This transparency creates a culture of accountability where teams are aligned around shared goals.
3. **Identifying Hidden Waste:** Dashboards often reveal “leaks” in the business. Perhaps you are overspending on a specific marketing channel that has a high bounce rate, or a specific product line has a high return rate that is eating all margins. Visualization makes these outliers impossible to ignore.
Implementation Strategy: Moving from Spreadsheets to Dynamic Dashboards
Transitioning to a custom dashboard system requires a structured approach. You cannot simply plug in your data and expect magic.
**Step 1: Audit Your Data Quality.** Garbage in, garbage out. Before moving to a dashboard, ensure your data sources are clean and consistent. If “Revenue” is calculated differently in your CRM than in your accounting software, you must standardize the definition first.
**Step 2: Define Your “Vitals.”** Do not track everything. Choose 5–7 “Vital” KPIs for each department. Overcrowded dashboards are rarely used.
**Step 3: Choose Your Integration Strategy.** Determine if you will use native integrations, third-party connectors (like Zapier), or custom API scripts. Native integrations are more stable, while APIs offer the most flexibility.
**Step 4: Iterate and Evolve.** A dashboard is a living document. As your business strategy changes in 2026 and beyond, your KPIs should evolve. Schedule quarterly reviews to assess whether your dashboard is still providing the insights you need to grow.
Frequently Asked Questions (FAQ)
#
1. How much does custom dashboard software cost in 2026?
Pricing typically follows a tiered SaaS model based on the number of users and data connectors. Entry-level professional tools start around $50–$100 per month, while enterprise-grade solutions with custom data warehousing and AI features can range from $1,000 to $5,000+ per month.
#
2. Do I need a developer to build a custom dashboard?
Not necessarily. Most modern platforms are designed for “power users” (managers and analysts) using no-code visual builders. However, for complex data transformations or connecting to legacy proprietary databases, a few hours of developer time for the initial API setup may be beneficial.
#
3. Can I integrate data from multiple different platforms?
Yes, this is the primary advantage of custom software. You can pull data from social media, financial software, CRM systems, and even IoT devices into a single, unified visualization.
#
4. Is my data safe in a third-party dashboard tool?
Reputable providers use high-level encryption and comply with GDPR, CCPA, and other global standards. Look for features like “Single Sign-On” (SSO) and the ability to set granular user permissions to keep your data secure.
#
5. How long does it take to implement a custom KPI dashboard?
A basic dashboard using native integrations can be set up in a few hours. A comprehensive enterprise-wide implementation involving multiple data sources and custom logic usually takes 2 to 6 weeks to fully refine and deploy.
Conclusion
The transition to custom dashboard software for KPIs represents a pivotal shift in how modern businesses operate. By moving away from static spreadsheets and fragmented reports, organizations gain the clarity needed to navigate the complexities of 2026. Custom dashboards provide more than just a visual representation of the past; they offer a roadmap for the future. By focusing on real-time data, user-centric design, and strategic KPI selection, business owners can ensure they are not just reacting to the market, but actively shaping their company’s destiny. In an era where information is abundant, the winner is not the one with the most data, but the one who can see it most clearly.